Stock analysis, explained without the noise.
See what actually changed, where the key levels sit, and what the news means for the stocks you follow. One daily analysis of your stocks.
Try “Apple”, “Nvidia”, or “S&P 500”.
See what actually changed, where the key levels sit, and what the news means for the stocks you follow. One daily analysis of your stocks.
Try “Apple”, “Nvidia”, or “S&P 500”.
On the short-term daily horizon, the overall technical bias for SPY remains bearish with moderate conviction, driven by persistent downward momentum.
On the short-term daily horizon, QQQ maintains a bearish technical bias as price action continues to trade below the primary moving average trend.
On the short-term daily horizon, technical bias is currently constrained by a bearish kicker detected on the latest completed bar.
On the short-term daily chart time horizon, TSLA exhibits an uptrend bias characterized by price trading above the EMA20 and the EMA5 positioned above the EMA13, supported by…
On the short-term daily horizon, Apple exhibits a bearish technical bias as price action remains pressured below key moving averages and momentum indicators favor sellers.
On the daily horizon, the short-term technical bias for NVDA is bearish, driven by persistent downward momentum and price positioning below key moving averages.
Analyzing the short-term daily horizon, Alphabet maintains a bearish technical stance driven by ongoing downside momentum and price action tracking below key moving averages.
On the short-term daily chart horizon, META exhibits a bearish technical bias with downward momentum.
On a short-term daily horizon, MSFT exhibits a bearish technical bias characterized by price action below the EMA20 and the fast EMA5 positioned beneath the EMA13.
On the short-term daily horizon, the technical bias for AMZN is bearish with conviction. Price action remains subdued below key moving averages, reflecting ongoing downward…
A rotating list built from free public attention and volume signals, based on the closing price of the previous trading day.
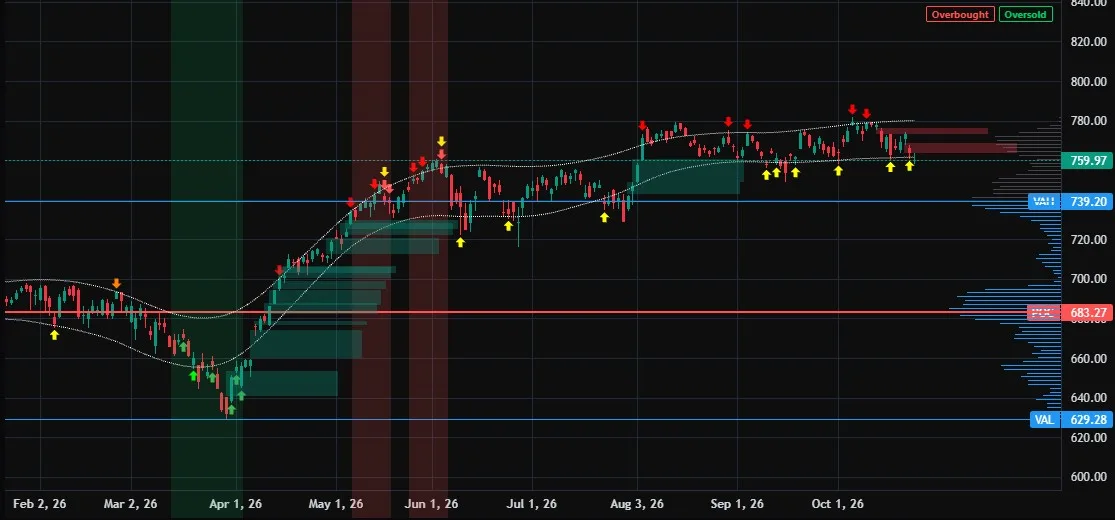
Each page includes a plain-language “today’s read”, support and resistance levels, a typical daily move, a completed-bar chart, an AI-assisted daily article, and publisher-labeled recent headlines.
The daily analysis runs after the US market close on weekdays. It refreshes the article and chart data for the watchlist once the session is complete. Weekend and pre-market passes may update the article when news changes.
The chart supports 15m, 1h, 1D, 1W, and 1M views. Signals use completed bars. The current 1D candle, the 1h partial, and the 15m preview are display-only.
Headlines and filings are merged from several financial news and public-filing sources. Items are limited to the rolling three-day window and labeled with the publisher domain, not the data provider.
No. TickerLevels provides educational technical analysis and news context. It is not a recommendation or an offer to buy or sell any security.
No. The public pages work without an account, and the watchlist is stored only in your browser.
Yes. Search accepts symbols, company names, and common aliases, then opens the matching ticker page.